-
Interval determination
Factors that will appear on the X axis of the final plots that you can view on page Explore relationships have had their values split into non equidistant intervals.
- The intervals created here are not equidistant, because the data distribution of the vast majority of factors is extremely skewed (as can be seen on the page Statistics). If the classic equidistant intervals were used (as was the case during the estimation process), the number of structures classified in the intervals would differ by as many as 5 orders (10s of structures in one interval, 10000s of structures in other intervals). Such structure count discrepancy would seriously impair the soundness of any claims made on the basis of data distributed in such way.
- Each interval contains at least 97 structures. Most factors have been divided into 88 - 100 intervals.
-
Box plot plotting
Box plots have been plotted for each interval of each factor that will appear for the X axis. This type of plot is useful for gaining insight into value distribution of every single interval. Using box plots, it has been determined that value variability in edge intervals (the first and the last one or two intervals at the beginning and at the end of every plot) of some factors is too high and thus their influence is too out of proportions in regards to the count of values they contain relative to the size of the dataset. Such problematic edge intervals have been, along with structures sorted into them, omitted from the statistical validation step of the analysis.
-
Histogram plotting
Histograms have been plotted for factors that were to appear on the Y axis of the final plots. They were used to assess whether values of those factors were reasonably lower bound as well as upper bound. All factors fulfilled this criterion.
-
Correlation analysis
Finally, the correlation analysis has been carried out. Averages (i.e., arithmetic means formally) of values of both paired factors have been computed for every interval. Then, Spearman correlation coefficient has been computed for every factor pair. Its value was then interpreted to determine presence and strength of a relationship using established guidelines, while its sign was interpreted to determine whether it is a direct, or indirect linear relationship. The semantic of Spearman coefficient value intervals has been established in this way:
- <0.7; 1.0): strong linear relationship
- <0.3; 0.7): moderate linear relationship
- (0.0; 0.3): weak or nonexistent relationship
Help
What is ValTrendsDB?
ValTrendsDB is a web database of discovered relationships between various structure and ligand factors. Relationships, stored in the database, have been discovered as a result of analyzing large amounts of freely available (macro)molecular data from prominent databases. These data encompass all macromolecular structures and associated metadata from the Protein Data Bank database, as well as validation information of structures and their ligands.
Users can explore relationships via plots of pairs of factors that have been generated and assessed during the analysis. Alternatively, it is also possible to visualize custom plots of factor pair relationships using fully custom settings, as well as explore value distribution of a factor. Users can also visualize custom values of PDB entries in every plot of two factors. In the case of further interest, the whole database, as well as all source data, can be downloaded.
The current version of ValTrendsDB is based on data from 4th September 2025. The database is updated once a week on Thursday at 10 PM UTC. Please note that the precise update time can change in the future. Users will be notified on the home page of ValTrendsDB if such change occurs.
Table of contents
- Description of ValTrendsDB pages
- Additional functionality of the ValTrendsDB website
- Scientific introduction
- Terminology
- Factor overview
- Data acquisition, processing and analysis
- Version overview
Description of ValTrendsDB pages
Explore relationships
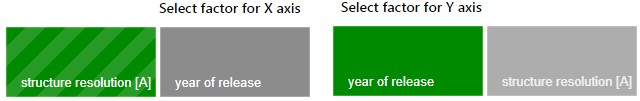
On page Explore relationships, you can explore (non)existing relationships between pairs of factors. You can select the first and the second factor from a set of tiles that are located to the left and right on the page below the plot. When you first visit this page, two factors will already be preselected - their tiles, along with the tiles of groups they belong to, will be striped green.
If you are interested in a different version of analysis data than the latest one, you can select your desired version using the version picker that is located above the plot. Note, however, that selecting a different version will reset currently selected pair of visualized factors.
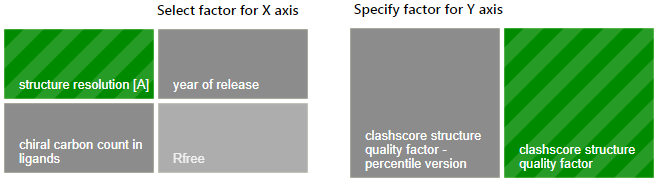
The process of choosing two factors for visualization is very intuitive. To choose a different factor for an axis of the plot, click on its tile (or click on the tile of its group, and then click on the tile of your requested factor that will show itself above). If your newly selected factor/factor group is incompatible with factor or factor group selected for the other axis of the plot (and its tile is thus filled with lighter shade of gray), the selection for the other axis of the plot will be cancelled and compatible factors for you to choose from will be painted solid green.
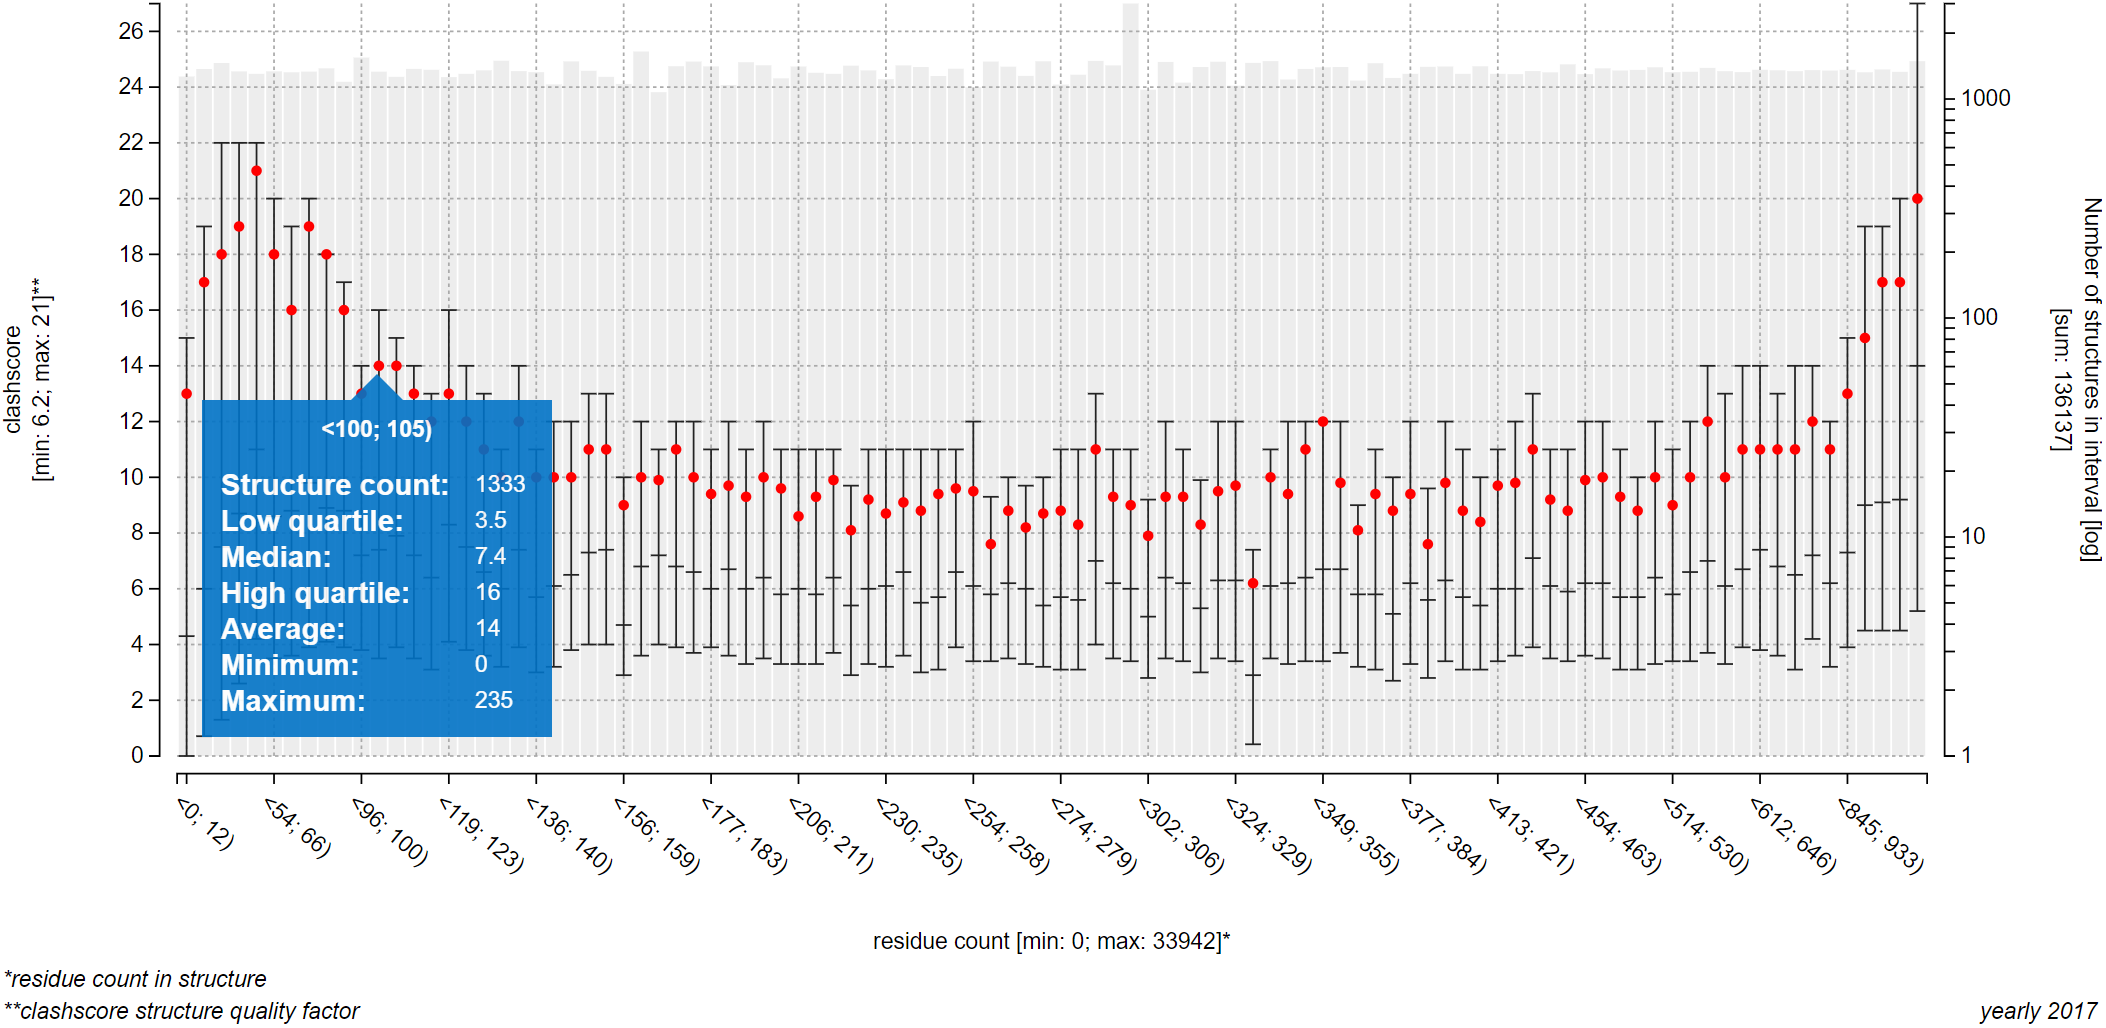
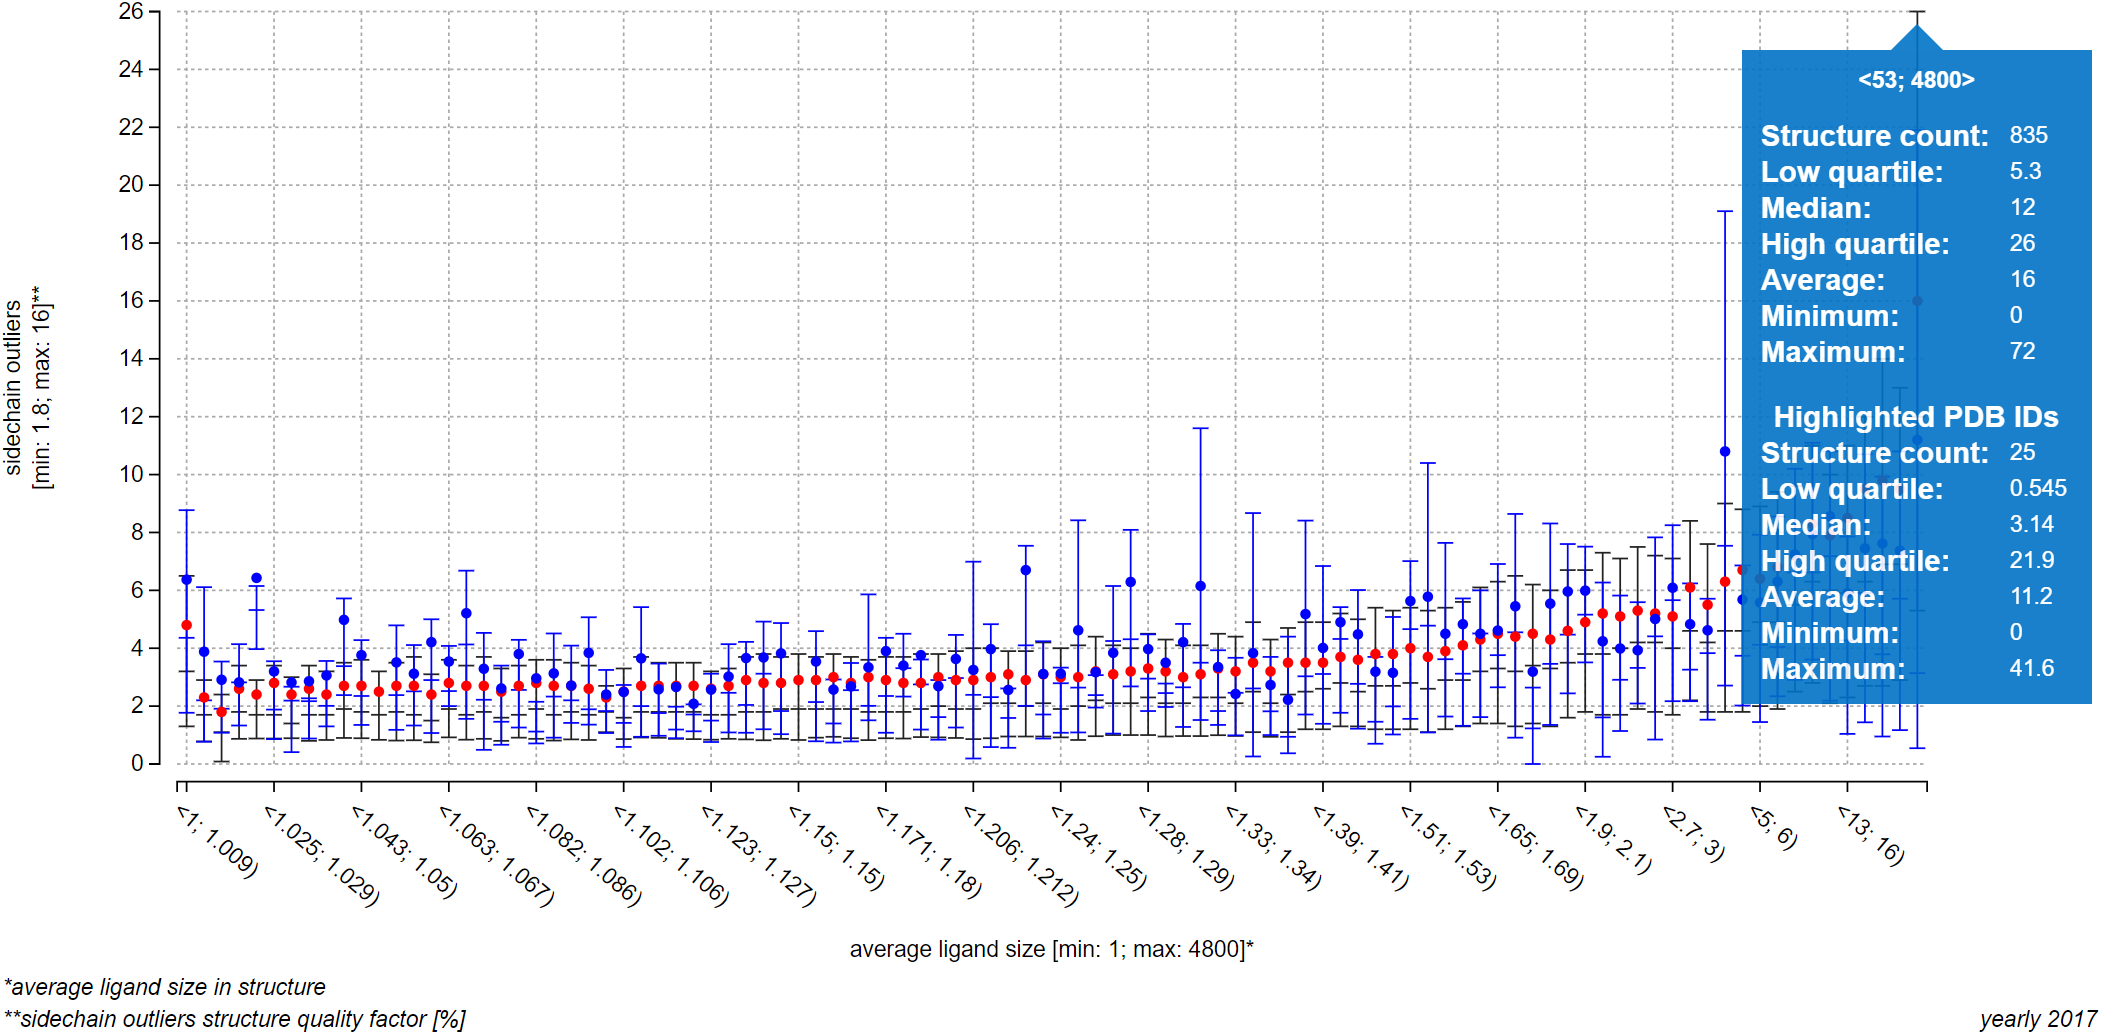
The plot on the upper part of page Explore relationships is an information-rich visualization tool made specifically for ValTrendsDB. The X axis, as well as the primary Y axis on the left, is labeled by factor group which factor is visualized on it, along with minimum and maximum values of this factor. The secondary Y axis shows the number of PDB structures in each interval using a gray bar plot, and is labeled by the total number of PDB structures considered in the plot. Values on the X axis show interval borders.
The main part of the plot consists of box plot-like floating bars (or a full box plot for plots with lower number of intervals) that show lower quartile, median and higher quartile values with their lower border, center bar and higher border (the center bar might be missing - in that case, median is equal either to the lower or to the higher quartile). These statistical values are represented on the primary Y axis. The whole floating bar can be represented by a single line symbol - in that case, all three values it represents are equal to the value of the symbol. The red dot in the box plot gives the average value of the factor on the primary Y axis.
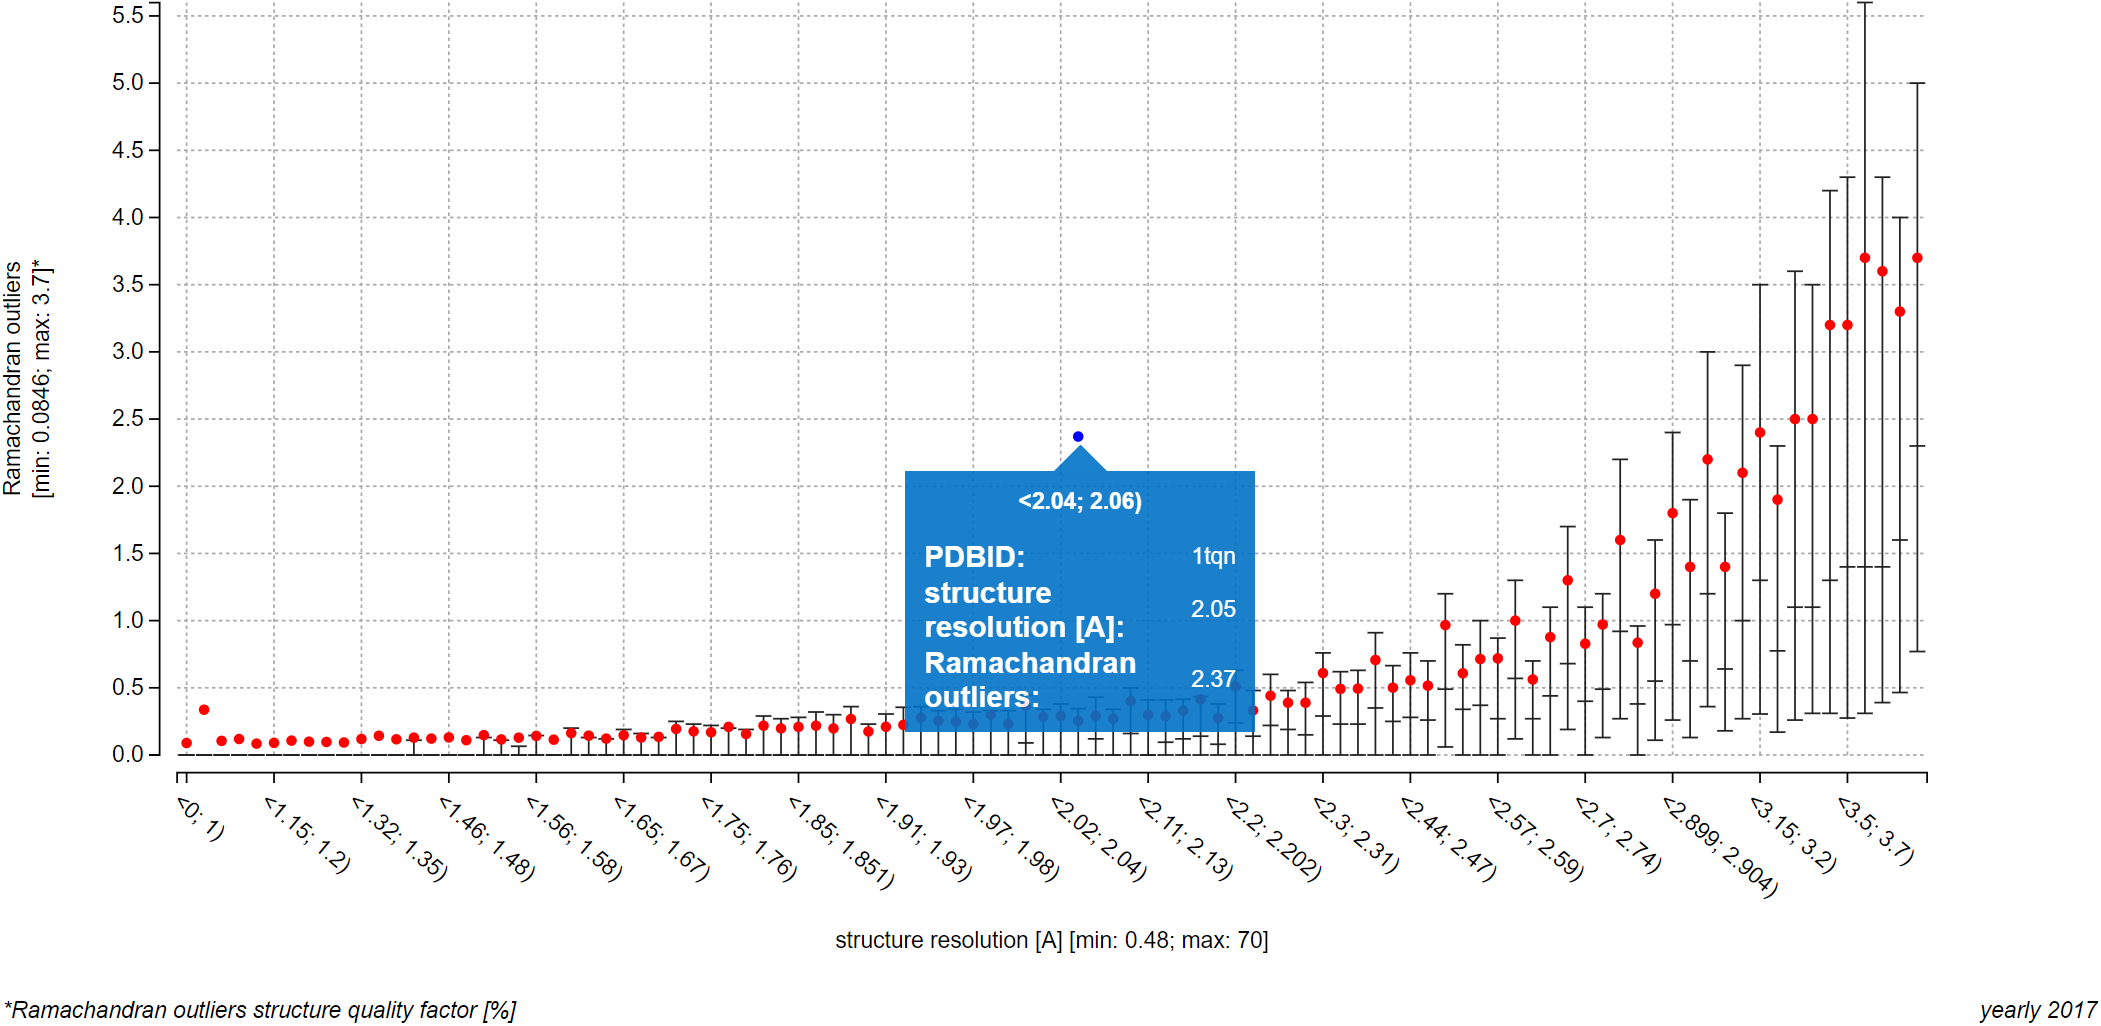
You can hover over an interval to view all visualized values in a pop-up window. Below the plot to the left are full names of factors shown in the plot. Factors not sorted into factor groups are an exception with their names not being listed in the bottom right corner of the plot, since their names are already written adjacent to the X or Y axis. Below the plot to the right is the name of the version of dataset which data were used to draw the plot.
Information content of the plot can be simplified using two of the three switch elements below the plot. The left switch can hide box plots, while the right switch can hide underlying bar plot that shows number of structures in each interval.

The ValTrendsDB website offers you two ways of using the displayed plots outside the website. If you want to download the current plot as a PNG file, you can click on the Export button. Alternatively, if you want to embed the interactive plot on your website, you can do it by clicking the Embed button and inserting the line of HTML code that appears into you website. More information about embedding can be found in section Embedding of interactive plots on your website.
You can also visualize your own set of PDB entries in each plot on this page. More information about this functionality can be found in section Visualizing a set of PDB entries in a plot.
Key trends
This page shows users some of the most interesting trends that can be found among data in ValTrendsDB. All plots shown on this page are interactive and are computed on-demand from the current version of data in the database. Users can interact with all the plots at once using controls at the top of the page, as well as choose a specific version of the dataset. These controls work in the same way as they do on page Explore relationships. Users can also visualize a set of PDB entries simultaneously on top of all plots on this page in the same way as it is possible to do so in the Explore relationships page.
Custom visualization
The functionality of page Custom visualization lets you visualize relationships between pairs of factors using your custom settings. The plot that you can depict has the same features as the plot on page Explore relationships. The control you have over the plotting process, however, is much wider. Plots created on this page are also slightly different than the ones that you get on page Explore relationships: Instead of semi-manual classification of data into manually refined intervals, page Custom visualization splits data of the X axis factor automatically using an algorithm.
First, you can choose a factor for the X axis, as well as a factor for the Y axis. Then, you can enable the custom plot settings section. Using that, you can:
- Modify the size of intervals that contain values of factor on the X axis of the plot. The algorithm that categorizes values into intervals is set to produce equidistant intervals that span the same range of values each.
- Limit total ranges of values of both factors using either sliders or text fields for direct entry.
- Employ the valid data filter. It will filter out structures that do not contain a valid value of selected factor.
- Employ the nonzero data filter. It will filter out structures which value of selected factor is either invalid, or equal to zero.
Plots on the Custom visualization page also support the recently added functionality, such as visualization of PDB IDs, export of plots as a static PNG drawing, and all of the additional functionality.
Examples
This page offers selected examples that let users discover the full potential in terms of presentation prowess that the ValTrendsDB database offers. These examples offer real-world use cases that utilize both visualization of global trends as well as values of specific PDB entries.
Statistics
Feature-rich plots that are offered to you on other pages of ValTrendsDB offer insight into relationships between pairs of relevant factors. However, they do not enable enough insight into value distribution of individual factors. This insight is provided on page Statistics, where you can draw bar plots that show number of occurrences of either each value, or a range of values of a factor (in the case of either a continuous factor, or a discrete factor with too many distinct values).
To draw such plot, simply choose a factor from relevant drop-down menu. X axis of these plots represents factor values (distinct values, or ranges of values), Y axis represents number of occurrences and has logarithmic scale to strengthen the expressiveness of this plot type. You can also hover over each bar of the plot to see what value (or range of values) and how many occurrences it represents.
You can also download additional results of relationship evaluation, analysis and statistical validation from this page, such as color coded tables of relationship strength of relevant pairs of factors, along with their Spearman coefficients. Details about the statistical analysis of data in ValTrendsDB are listed in relevant parts of the Help. Please note that tables of relationship strengths are not updated automatically, and are thus available only for yearly versions of the dataset. Details about dataset versions are listed here.

Data download
All data that are relevant to this database can be downloaded from page Data download. That includes raw data from both sources, as well as complete dataset of ValTrendsDB with merged entries for all PDB structures. Additional results of statistical processing and validation (color coded table of relationship strength and Spearman coefficients) can be downloaded from this page as well.
Additional functionality of the ValTrendsDB website
Visualizing a set of PDB entries in a plot using the search field
ValTrendsDB offers functionality that enables its users to compare quality of one or more PDB entries to the global trends that is shown in a plot. You can visualize values of PDB entries in every plot of two factors.
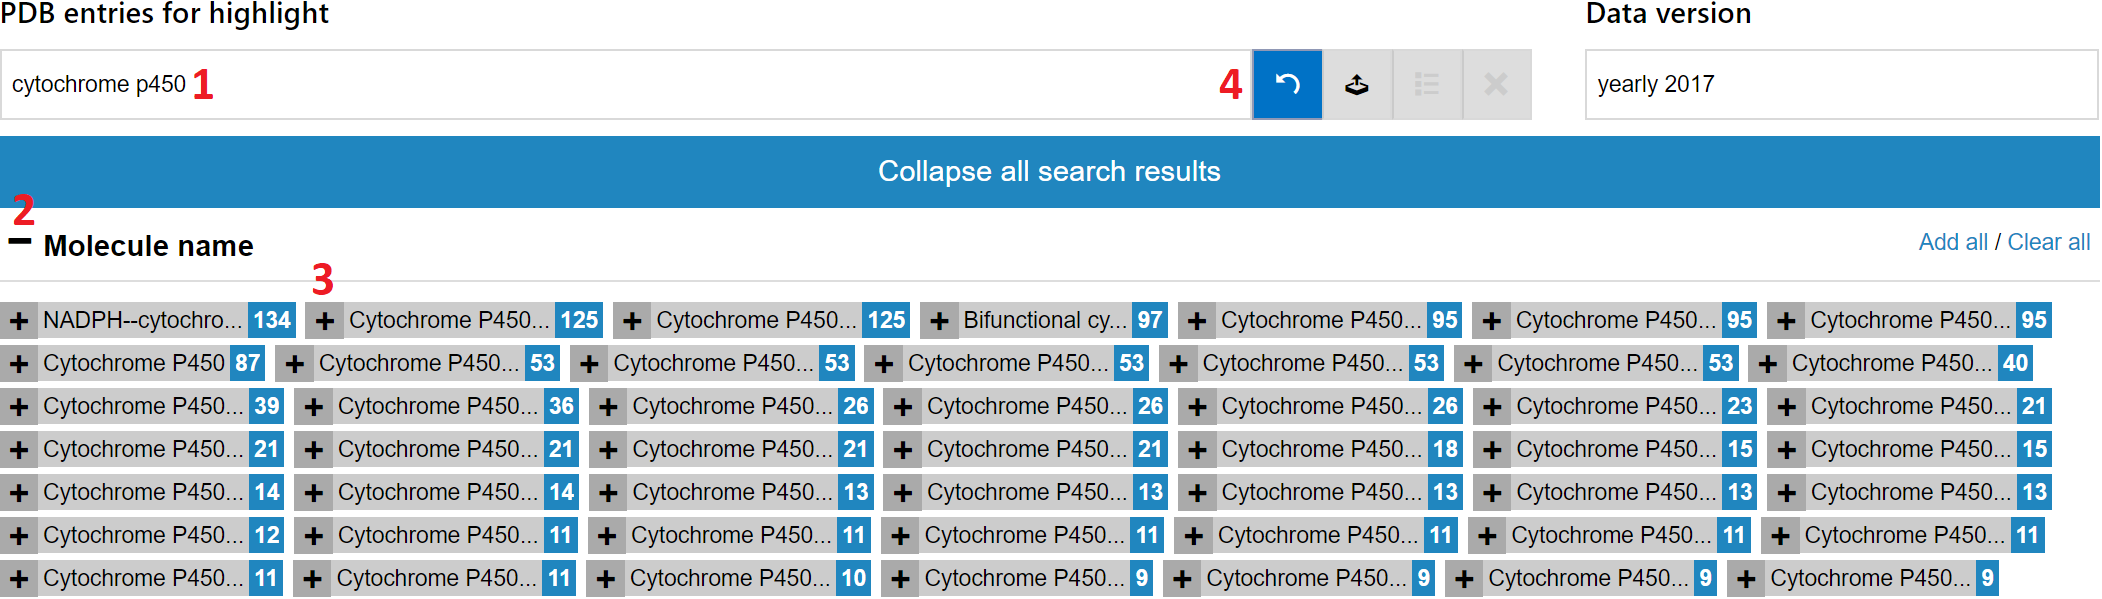
It is simple, since ValTrendsDB offers search field that is linked to the PDBe database. Users can simply type their search query into the "PDB IDs for highlight" field that is situated above the plot to the left. You can visualize a set of PDB entries in four easy steps:
- First, enter a suitable search term into the "PDB IDs for highlight" search field. A list of categories will emerge below the smart search field.
- Since we are interested in entries that represent structure models of proteins from the Cytochrome P450-cam family, click the "+" sign next to the "Molecule name" category to expand this category.
- Then, click the "+" sign to add all entries from the Cytochrome P450-cam family to the plot.
- To confirm the selection of a set of entries to visualize, click the checkmark button that has turned green. After a brief period of loading, the currently selected plot will contain values of each visualized PDB entry from the selected set.
An example of this simple search query can be seen on the screenshot below.
Alternatively, you can also search for entries to visualize by formulating a query for full-text search. Results of the full-text search on ValTrendsDB are the same as if you entered your query into the search field of the PDBe website. To perform a full-text search, simply type your query into the smart search field and either press the Enter key on your keyboard, or click the Full-text search button below the search field. Please note that the Full-text search button is available only when no results were found for your search query using the regular categorized search. However, the Enter key on your keyboard will still initiate a full-text search regardless.

When full-text search results are retrieved and displayed, you can:
- Click on individual retrieved entries to include or exclude them from the set of PDB entries that is poised for visualization.
- When a lot of entries are retrieved, they are split into pages. Each page contains 250 entries at most. Each page with search results can be accessed using numbered buttons below the smart search field.
- You can include all retrieved PDB entries into the set poised for visualization using the Add all link. Similarly, you can exclude all retrieved PDB entries from the set using the Clear all link.
- To confirm the selection of a set of entries to visualize, click the checkmark button that has turned green. After a brief period of loading, the currently selected plot will contain values of each visualized PDB entry from the selected set.

However, the visualization functionality of a set of PDB entries goes even further, as you can see on the screenshot below:
- The number next to a category name shows how many PDB entries from such category are set for visualization.
- The number in dark blue rectangle next to a term represents how many PDB entries this term represents. If some PDB entries from a term are set for visualization, a number in light blue rectangle shows how many of them are set for visualization.
- The green number next to the "PDB IDs highlight" caption above the search field shows how many PDB entries are actually visualized in the plot.
- You can download a textual CSV file with all ID of visualized PDB entries along with values of all factors of these entries from the currently used dataset. Values of the two factors shown in the plot are listed first.
- You can add more PDB entries to the set of visualized entries in the same way as you did with the first set.
- If you want to add (or remove) all PDB entries from a category to (or from) the set of visualized PDB entries, you can use the "Add all" (or "Remove all") link that is situated on the same level as is the category name.
- If you want to add or subtract entries from the visualized set, you can click on the "Show current PDB IDs" button that becomes enabled when some entries are already visualized in the plot. Then, you can subtract whole categories using the "Clear all" link (2), as well as whole terms using the "-" button. Additionally, you can add or subtract single entries as you see fit. Finally, click on the green checkmark button to confirm your selection.
- If you want to purge all visualized entries from the plot, you can click on the "Clear all PDB IDs" button that also becomes enabled when some entries are already visualized in the plot. To confirm your choice, click on the green checkmark button.
- To return back to the plot, click the blue "Back to plot" button. Please note that this button turns green if there were any changes made to the set of visualized entries.

Single PDB entries can also be added or subtracted from the set of visualized entries, as is shown on a screenshot below:
- By simply clicking on a search term, you are presented with a list of PDB entries that belong to this search term.
- You can then click on each PDB entry anywhere in its rectangle (except the area of the citation link) to add or subtract it from the set of visualized entries.
- When satisfied, you can click on the "return to category" button to get back to the search interface.

The only requirement for a PDB entry to be visualized in a plot in this way is that it has to be included into the dataset of ValTrendsDB and that it has to have a value for both factors of the plot. Each successfully visualized PDB entry will then be represented as a blue point in the plot. If you hover over a blue point in the plot, you can view the PDB ID of the entry it represents as well as its values of both factors.
If you wish to visualize many PDB entries in this way, you can let ValTrendsDB compute a box plot from all the visualized PDB entries by switching on the "Show box plot for the highlighted entries" switch centered below the plot. Blue boxes show upper quartile, median, and lower quartile values using its upper, middle, and lower horizontal lines respectively. Upper quartile, lower quartile, and median values can have the same value for an interval. In such case, two of the horizontal lines (or all three of them) in a box will blend into only one. Average values blue dots. All values from both box plots can be viewed in a pop-up window when you hover over an interval. This way, the interpretability of the information-rich plots in ValTrendsDB is preserved even for rather busy plots.
Please note that boxes of the box plot for PDB entries are shown only for intervals that contain at least one visualized PDB entry. Also, visualization of a large number of PDB entries in a plot may take significant time, even minutes. The page itself may become slow to respond when many PDB entries are visualized in this way. There, even though there was no upper limit set of the number of entries visualized in a plot, a realistic maximum for preserving responsiveness of the webpage is around 10 thousand entries. You can certainly visualize more entries, but please be prepared to wait for a bit.
This functionality is quite potent - you can consult the Examples page for realistic use cases.
Visualizing a set of PDB entries in a plot by manually providing PDB IDs
Users can provide their own list of PDB IDs to ValTrendsDB for visualization without the use of the smart search field. There are actually three ways for accomplishing this task.
The first way is the most straightforward one:
- Simply type (or paste) IDs of PDB entries that you want to visualize into the smart search field. The IDs can be separated by a space, a tabulator, a comma, a semicolon, a plus symbol, a dash, or an underscore (please do not mix separators in one query). Then, confirm your intent by pressing Enter on your keyboard (or clicking away for the smart search field so that it loses focus).
- The successfully parsed IDs will be shown below the search field in its own category. You can deselect entries that you do not want to be visualized after all.
- You can also select or deselect all PDB entries parsed.
- Number of entries considered for visualization is shown next to the name of the category. If there are some directly entered PDB entries that are already visualized, their number will be added to the number of newly parsed entries.
- When you are satisfied with the selection of entries for visualization, you can confirm it using the green button.

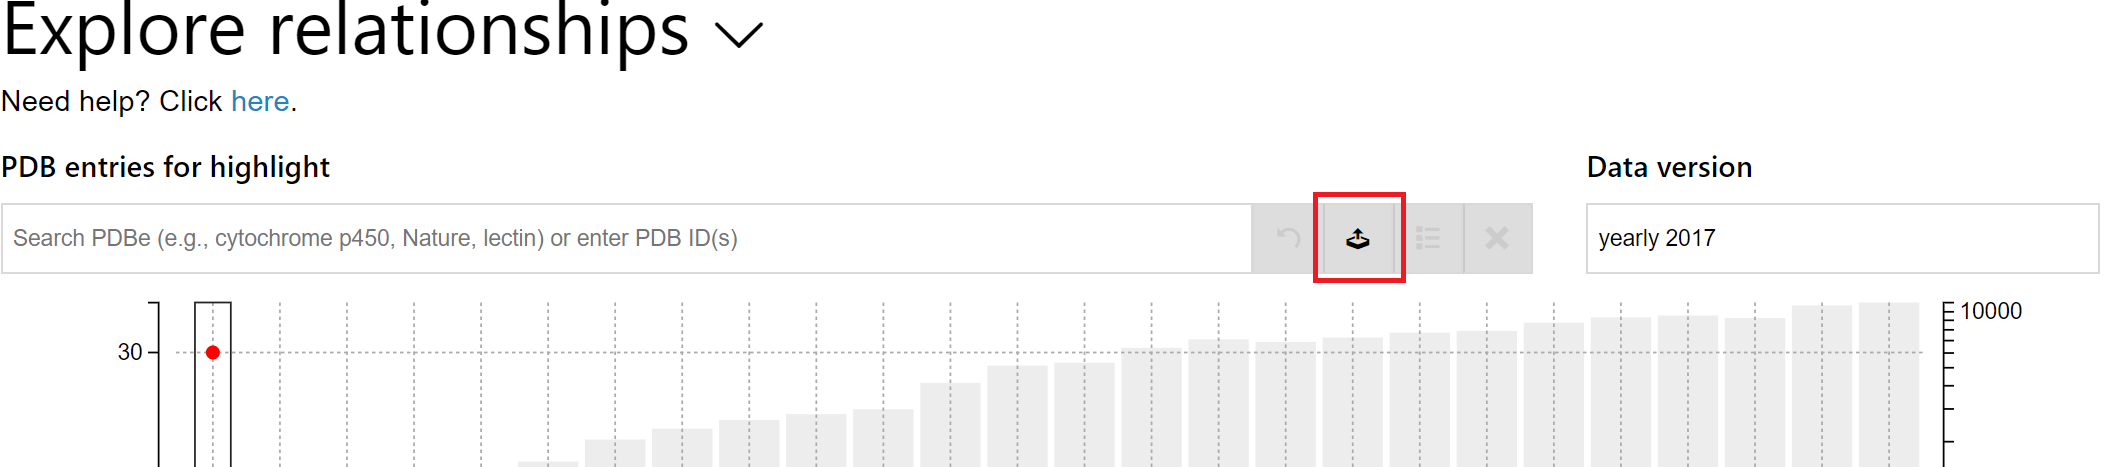
The second way is more suitable for providing a large number of IDs to ValTrendsDB, since internet browsers have performance problems when large texts are pasted to editable fields on web pages. It consists of uploading a text file with a list of IDs to ValTrendsDB. To do so, start by clicking on the Upload PDB IDs from a file button to the right of the smart search field. An upload dialog window will appear on the page.
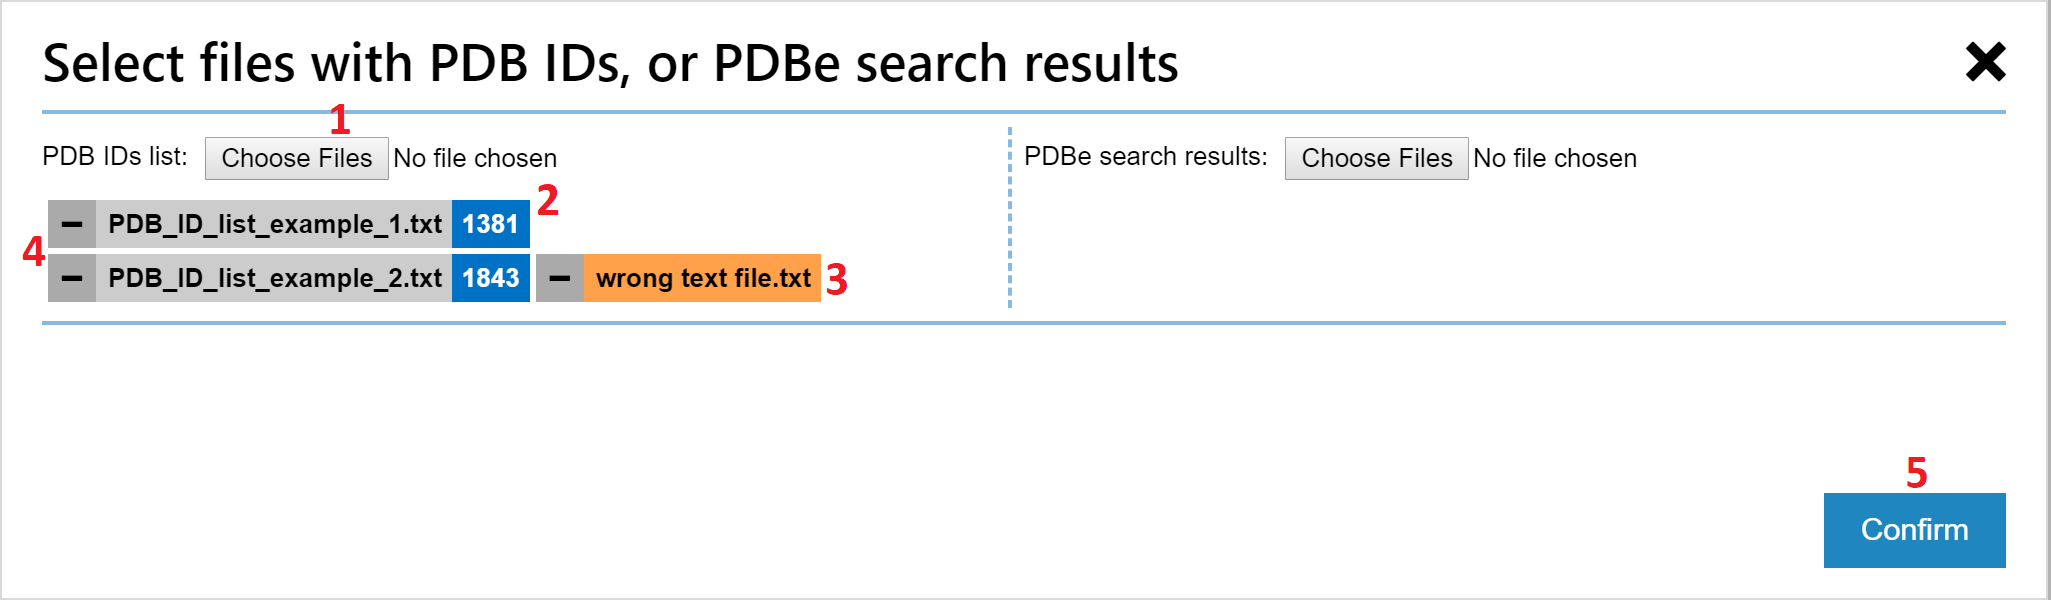
In the upload dialog window:
- Click on the Choose Files button to choose one or more text files with PDB IDs. You will see the list of parsed files below the button. You can still add more files by using the button repeatedly.
- Each successfully parsed text file will have the number of parsed PDB IDs shown next to its name.
- If no PDB IDs have been parsed from a file, its name is shown in black on orange background.
- Each file (and its PDB IDs) can be omitted from the selection of PDB entries to visualize by clicking the minus sign next to its name.
- When done uploading and selecting PDB entries for visualization, you can confirm your choice via the Confirm button.
Users are able to omit each PDB entry from the set for visualization in the same way as they are able to do so with entries that they have discovered using the smart search field.
The third way of manually providing PDB IDs for visualization takes advantage of powerful search functionality of the PDBe website. Using this functionality, users can search for interesting PDB entries using complex queries. Then, they can download the search results as an XML, JSON, or CSV text file, and upload it to ValTrendsDB, which in turn visualizes the discovered set of entries into a plot of user's choice. Both preferences can be set in the PDBe download window. A screenshot of the search results download window at PDBe is below.
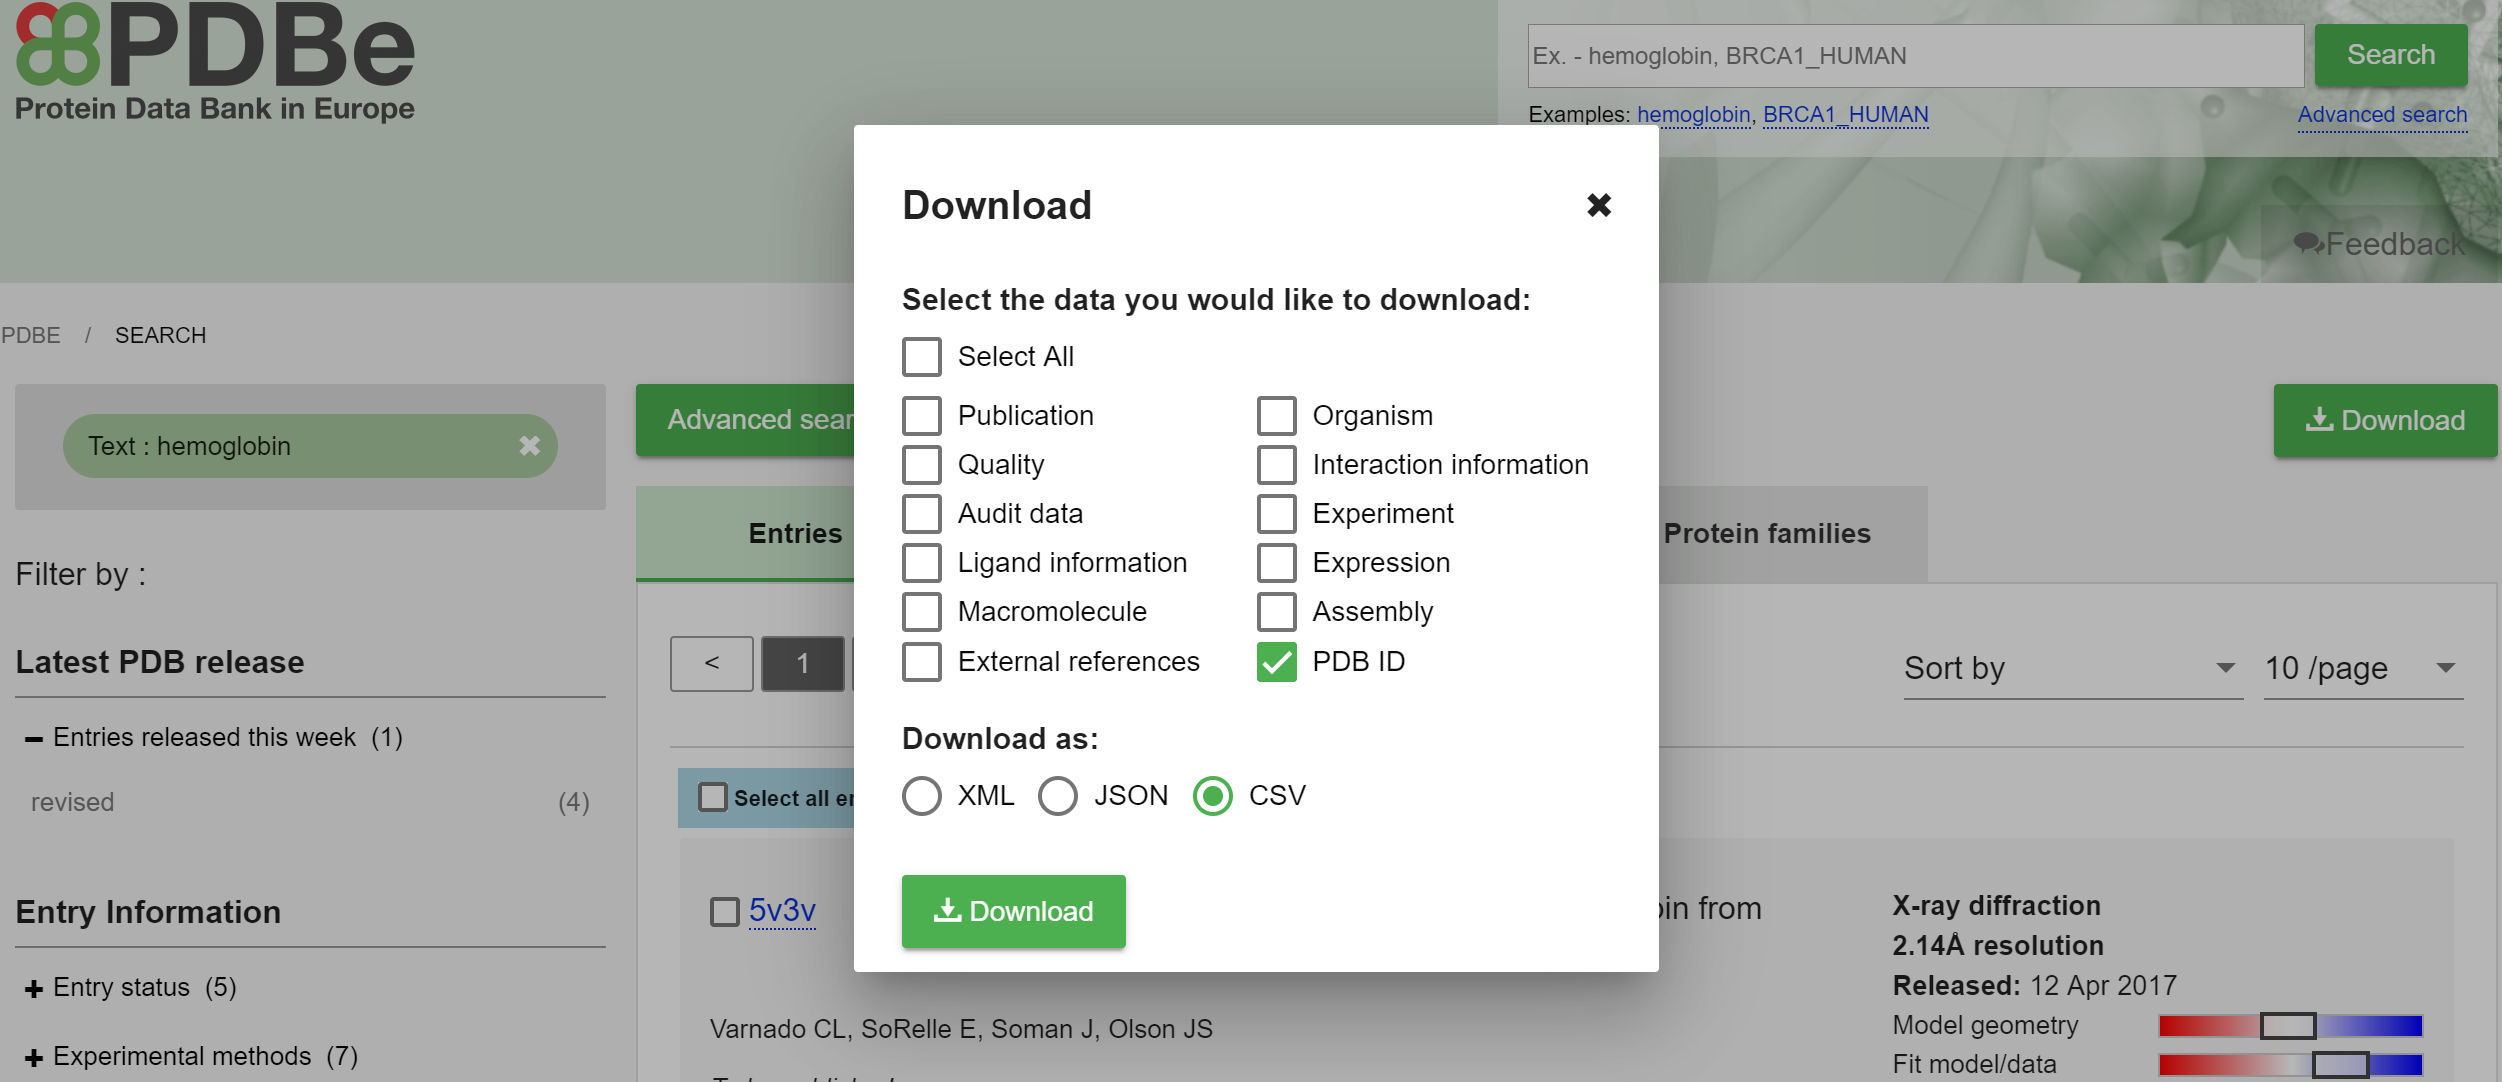
The only limitation to the upload functionality of ValTrendsDB is that the file should be 60 MB or less. This limitation comes from default memory size limits of contemporary internet browsers. However, this file size limit rarely prohibits users in their use cases. If your downloaded search results exceed the 60 MB quota, try downloading only PDB IDs of your query results, and try to do so into the CSV text file format. Both preferences can be set in the PDBe download window.
When you have your search results ready, you can upload them using the upload windows in ValTrendsDB described above. The only difference to the above mentioned description is that you will use the right portion of the download window instead.
A key advantage of the PDB entry visualization functionality of ValTrendsDB is that you can combine all means of entering and discovering PDB IDs for visualization together. The sky is the limit!
Opening the ValTrendsDB website with a query string
It is possible to supply additional parameters to the link of a ValTrendsDB page (e.g., webchem.ncbr.muni.cz/ValTrendsDB/explore.php). Such parameters modify behavior of the page, and remain in effect for as long as you use it via the parameterized link as long as you do not override settings of the parameters using controls on the page. This functionality is useful is a lot of situations, e.g., when you want to send a link to a colleague and you want him to see the exact same plot as you do. Also, these parameters are useful when you are configuring the final look of an embedded interactive plot.
Parameters are supplied to the website as a part of its hyperlink, e.g., webchem.ncbr.muni.cz/ValTrendsDB/explore.php?xfactor=year+of+release&yfactor=Rfree&plotmajor=false&embed. Parameters follow after a question mark "?". Some parameters require, after an equal sign "=", a string or a number, while other require a logical value ("true" or "false"). Another group of parameters does not require any additional data to be supplied. The plus sign "+" is used where a space would normally be, since hyperlinks cannot contain spaces.
These parameters can be applied to links either to the Explore relationships page, or to the Custom visualization page:
- xfactor=factor+name: Full name of the factor that is supposed to be visualized on the X axis of the plot. Works only in conjunction with the yfactor parameter. Factors from xfactor and yfactor parameters must be compatible (only for the Explore relationships page).
- yfactor=factor+name: Full name of the factor that is supposed to be visualized on the Y axis of the plot. Works only in conjunction with the xfactor parameter. Factors from xfactor and yfactor parameters must be compatible (only for the Explore relationships page).
- version=version+name: Full name of the version of data for the plot to be drawn from.
- plotmajor=false: Do not show boxes with median and quartile values in the plot.
- plotminor=false: Do not show the number of structure in each interval in the plot (secondary Y axis, light gray bar plot).
- plotpdbidsavmed=true: Show average and median values of visualized PDB entries instead of one data point for each visualized PDB entry.
- pdbid=id1+id2+...: Highlight values of one or more PDB entries in the plot. The IDs are separated by a plus sign.
- embed: Shows the webpage in the embedded version, i.e. only the plot is shown, while the rest of the webpage is hidden. The plot is also set to fill the whole window. This behaviour is useful for plot embedding (see section Embedding of interactive plots on your website for more infromation.
These parameters can be applied to links only to the Custom visualization page:
- bucketwidth=number: Width of intervals in the plot.
- notplotminmax=false: Plot minimum and maximum values of each interval in the plot (this feature is off by default).
- xlt=number: Lower limit of values of the factor visualized on the X axis.
- xul=number: Upper limit of values of the factor visualized on the X axis.
- ylt=number: Lower limit of values of the factor visualized on the Y axis.
- yul=number: Upper limit of values of the factor visualized on the Y axis.
- vdfval=factor+name: Factor that is supposed to be used as a valid data filter. A valid data filter will filter out entries from the plot that do not have a valid value for the filter factor.
- vnzdfval=factor+name: Factor that is supposed to be used as a nonzero data filter. A nonzero data filter will filter out entries from the plot that do have a zero value for the filter factor.
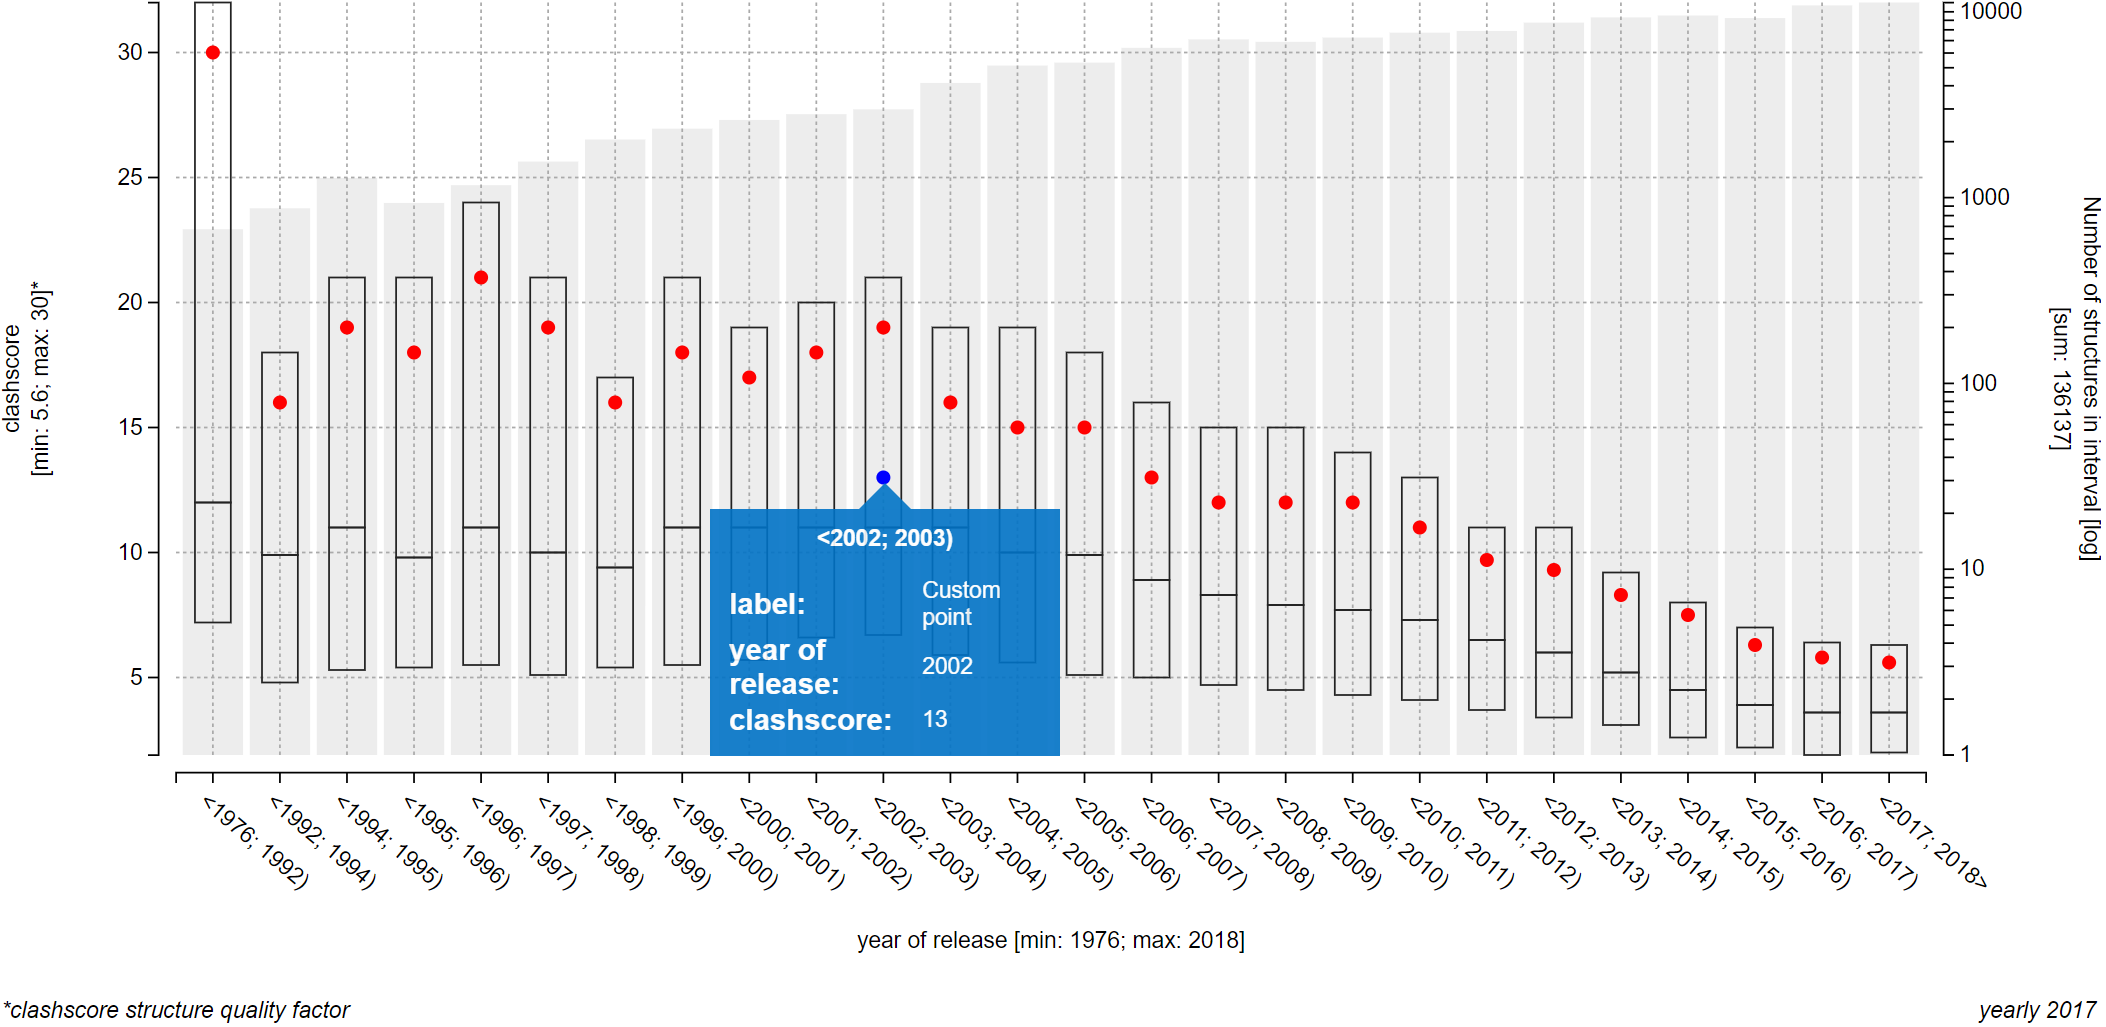
Visualizing a custom pair of values in a plot
If you want to visualize a data point that belongs to a PDB entry, but the entry is not present in the dataset of ValTrendsDB, you can visualize it anyways. It is possible to do so on both pages Explore relationships and Custom visualization. You can even assign a label to you custom point that will be shown when hovering over it. The only limitation you have is that you can visualize only one data point this way.
Relevant parameters for this functionality are:
- x=number: Value on the X axis for the custom data point.
- y=number: Value on the Y axis for the custom data point.
- label=label+text: Label of the custom data point. If no label is supplied, a default one is used.
If you want to know more about parameters of a query string, you can consult the previous subchapter.
Embedding of interactive plots on your website
If you want to embed a plot from Explore relationships or Custom visualization pages on your own website, you can first configure the plot that you want to embed in a way that you desire. Then, you can click on the Embed button below the plot. The iframe tag will be copied to you clipboard. You can then insert this tag into your website.
The content of the iframe tag can be modified using the same parameters as can be used to open the ValTrendsDB website using a query string. List of those parameters can be found in previous subchapters Opening the ValTrendsDB website with a query string and Visualizing a custom pair of values in the plot. The size, look and positioning of the iframe itself can be modified using relevant HTML and CSS practices. A basic overview of the iframe tag can be found here.
Scientific introduction
Biomacromolecular structural data are one of the most interesting and important results of modern life sciences. Impressive scientific outputs have been published and 13 Nobel prizes awarded for research based on these data. Moreover, all the resolved structures are accessible to the research community via the Protein Data Bank (PDB) database (Burley et al., 2018). A key consideration in the examination and analysis of biomacromolecular data is their reliability and quality. Therefore, the validation of biomacromolecular structures has become an important topic. The necessity of validation was highlighted when some published structures were found to contain serious errors (Matthews, 2007; Johnston et al., 2008; Kleywegt, 2009; Rupp, 2012).
First, validation of biomacromolecules and their complexes was focused mainly on checking the standard building blocks (residues), namely standard amino acids and nucleotides. The usual methodology has been to evaluate the specific properties of all of these standard residues (e.g., electron density, atom clashes, bond lengths, bond angles, torsion angles). These approaches are embedded into common validation software tools such as PROCHECK (Laskowski et al., 1993), WHAT CHECK (Hooft et al., 1996), PROCHECK-NMR (Laskowski et al., 1996), AQUA (Laskowski et al., 1996), OOPS (Kleywegt and Jones, 1996), and MolProbity (Chen et al., 2010).
Afterwards, the more challenging topic of ligand quality also attracted the attention of researchers. Initially, it was done in a similar manner as for the standard residues (with the focus on electron density, atom clashes, etc.). Such a methodology is implemented in several validation software packages: Mogul (Bruno et al., 2004), ValLigURL (Kleywegt and Harris, 2007), PHENIX (Adams et al., 2010), and Coot (Debreczeni and Emsley, 2012). Another method for validation of ligands is to compare them with their model structures to determine whether their features correspond as expected to the 3-letter code that was assigned to them in the PDB. This approach is applied in pdb-care (Lütteke and Von der Lieth, 2004), MotiveValidator (Svobodová Vařeková et al., 2014) and ValidatorDB (Sehnal et al., 2015). A big step forward in the field of validation was the release of the worldwide Protein Data Bank (wwPDB) validation reports (Gore et al., 2017). These reports are generated for each structure in the PDB, are available via the web pages of the PDB and include information about both standard residues and ligands. The topic of validation is still a field of intensive discovery, as was shown in the first wwPDB/CCDC/D3R Ligand Validation Workshop (Adams et al., 2016).
A major question is how these validation efforts influence the real quality of structural data. And in general, how structure quality is changing and which factors affect it. Despite having a lot of information about various structure quality criteria in addition to a great deal of information about a structure’s properties (e.g., geometrical, experimental, biochemical), the data about the relations between them are not available yet.
This stimulated us to focus on an analysis of validation trends. Our research is based on validation data from wwPDB validation reports and the ValidatorDB database. During our analyses, we first asked isolated questions such as: Which particular quality criteria are improving in newer structures and which are stagnating? Does the quality of a structure decrease with its size? Does the quality of a structure improve with its better resolution?
Our cooperation with the Protein Data Bank in Europe (PDBe), the developers of wwPDB Validation Reports, motivated us to approach this problem in a general manner. Specifically, we developed the ValTrendsDB database, which enables the whole research community to see the current state of biomacromolecular structure quality - the progress, the trends, and also the problems. ValTrendsDB shows the relations between available quality criteria and a rich set of biomacromolecular properties (e.g., size, number of atoms, resolution, number of ligands, year of publication, ligand flexibility). Among other features, the relations between two biomacromolecular properties can also be seen. Therefore, ValTrendsDB contains information about 1,950 trends (i.e., meaningful pairings between a quality criterion and a property, between two properties, or between two quality criteria) in its yearly 2018 version.
Recently, we have added new functionality to the ValTrendsDB database. This functionality lets users interactively explore trends from the analysis and compare them to trends of sets of structures defined by users themselves, e.g., experimental method, structures of a journal, structures from an author, or protein family.
References
- Adams,P.D. et al. (2016) Outcome of the First wwPDB/CCDC/D3R Ligand Validation Workshop. Structure, 24, 502–508. Link.
- Adams,P.D. et al. (2010) PHENIX: a comprehensive Python-based system for macromolecular structure solution. Acta Crystallogr. Sect. D. Biol. Crystallogr., 66, 213–221. Link.
- Bruno,I.J. et al. (2004) Retrieval of crystallographically-derived molecular geometry information. J. Chem. Inf. Comput. Sci., 44, 2133–2144. Link.
- Burley,S.K. et al. (2018) Protein Data Bank: The single global archive for 3D macromolecular structure data. Nucleic Acids Res., 47, D520–D528. Link.
- Chen,V.B. et al. (2010) MolProbity: all-atom structure validation for macromolecular crystallography. Acta Crystallogr. Sect. D Biol. Crystallogr., 66, 12–21. Link.
- Debreczeni,J.É. and Emsley,P. (2012) Handling ligands with Coot. Acta Crystallogr. Sect. D. Biol. Crystallogr., 68, 425–430. Link.
- Gore,S. et al. (2017) Validation of Structures in the Protein Data Bank. Structure, 25, 1916–1927. Link.
- Hooft,R.W.W. et al. (1996) Errors in protein structures. Nature, 381, 272. Link.
- Johnston,C.A. et al. (2008) Structure of the Parathyroid Hormone Receptor C Terminus Bound to the G-Protein Dimer Gβ1γ2. Structure, 16, 1086–1094. Link.
- Kleywegt,G.J. (2009) On vital aid: the why, what and how of validation. Acta Crystallogr. Sect. D Biol. Crystallogr., 65, 134–139. Link.
- Kleywegt,G.J. and Harris,M.R. (2007) ValLigURL: a server for ligand-structure comparison and validation. Acta Crystallogr. Sect. D. Biol. Crystallogr., 63, 935–938. Link.
- Kleywegt,G.J. and Jones,T.A. (1996) Efficient rebuilding of protein structures. Acta Crystallogr. Sect. D. Biol. Crystallogr., 52, 829–832. Link.
- Laskowski,R.A. et al. (1996) AQUA and PROCHECK-NMR: Programs for checking the quality of protein structures solved by NMR. J. Biomol. NMR, 8, 477–486. Link.
- Laskowski,R.A. et al. (1993) PROCHECK: a program to check the stereochemical quality of protein structures. J. Appl. Crystallogr., 26, 283–291. Link.
- Lütteke,T. and Von der Lieth,C.-W. (2004) pdb-care (PDB CArbohydrate REsidue check): a program to support annotation of complex carbohydrate structures in PDB files. BMC Bioinformatics, 5, 69. Link.
- Matthews,B.W. (2007) Five retracted structure reports: Inverted or incorrect? Protein Sci., 16, 1013–1016. Link.
- Rupp,B. (2012) Detection and analysis of unusual features in the structural model and structure-factor data of a birch pollen allergen. Acta Crystallogr. Sect. F Struct. Biol. Cryst. Commun., 68, 366–376. Link.
- Sehnal,D. et al. (2015) ValidatorDB: database of up-to-date validation results for ligands and non-standard residues from the Protein Data Bank. Nucleic Acids Res., 43, D369–D375. Link.
- Svobodová Vařeková,R. et al. (2014) MotiveValidator: interactive web-based validation of ligand and residue structure in biomolecular complexes. Nucleic acids Res., 42, W227–W233. Link.
Terminology
- Structure
- A structure of a biomacromolecule is the three-dimensional arrangement of atoms in such molecules. Structure of a biomacromolecule can be determined by numerous methods, e.g. X-ray crystallography or NMR spectroscopy. Determined structures are stored in databases, the largest being the PDB. Since the structure is what represents real-life biomacromolecules in silico, they are referred to as structures across all ValTrendsDB pages.
- It is also worth noting that for the purposes of ValTrendsDB, only structures determined using X-ray crystallography are considered.
- Biopolymer
- Biopolymer refers to a polymeric molecule of biological origin in general. Biopolymers stored in the PDB database are proteins, nucleic acids and polysaccharides. They consist of standard residues named amino acids, nucleotides and monosaccharides respectively.
- For the purpose of ValTrendsDB, biopolymer name refers to parts of a PDB structure that are built from standard residues, and are not ligands of water molecules.
- Chain
- A chain is a single biopolymer molecule. Larger biomacromolecule complexes can consist of more than one chain. Spatial superposition of chains determine quaternary structure of such complex.
- Assembly
- Assembly is an arrangement of units that form a biomacromolecular complex together. Some assemblies consist of only one chain and no ligands, while other assemblies are made of hundreds of biopolymers and ligands. Each entry of the PDB database has exactly one preferred assembly.
- Residue
- Residue, as in standard residue, is a molecule that comprises biopolymers. It is not a ligand.
- Ligand
- Ligands are molecules that interact with biomacromolecules. Those interactions enable biomacromolecules to fulfill their roles in living organisms. Ligands are rarely covalently bound to biomacromolecules - non-covalent interactions are much more common. From the point of view of the PDB database, everything that comprises a PDB structure and is not a standard residue is a ligand.
- In ValTrendsDB, water molecules are considered as being ligand by most factors that deal with ligands and ligand data with the exception of factors based on MotiveValidator output and factors where water molecules are explicitly omitted (e.g. average ligands size in structure, disregarding water ligands factor).
- Ligand validated
- by MotiveValidator
- ValidatorDB contains validation results, computed by MotiveValidator, for only a subset of ligands stored in structures in the PDB. Specifically, in considers only ligands that are nontrivial (i.e. ligands that contain at least 7 atoms of element other than hydrogen). Derivatives of standard residues are omitted as well[link].
- Factor
- For the purpose of ValTrendsDB, factor is a metric of a certain property of a PDB structure. Quantified properties range from various interpretations of simple atom count to complex quality metrics of biopolymers and their ligands.
- Factor group
- Factor groups have been established to group together similar factors for user convenience, since e.g. on page Explore relationships it is easier to pick from fewer factor groups first than to pick from all the factors offered at the same time.
- Z-score
- Z-score is defined as the difference between an observed value and either expected or average value, divided by the standard deviations of either the expected or the average value[link]. Z-scores are used in PDB validation reports.
- Relationship
- In the context of ValTrendsDB, if there is a relationship between a pair of factors, then there is a degree of linear correlation between their values. This correlation has been statistically quantified during the statistical analysis step.
Factor overview
2,108 pairs made of 92 factors in total have been considered across all versions of the dataset. Among the considered factors are structure metadata factors along with structure size factors, structure quality factors, and ligand quality factors. Because of their total count, factors have been split into groups for user convenience.
Structure metadata factors
Atom count factor group contains factors that sum all atoms of parts of a PDB structure (structure itself, non-water ligands of a structure, water molecules of a structure). Parts of PDB structures considered are different for nearly every factor in this group (see the name of each factor). Available in versions: current, yearly 2018, yearly 2017, yearly 2016, yearly 2015.
- Atom count of ligands in structure
- Atom count of ligands in structure, considering only ligands containing metal atoms
- Atom count of ligands in structure, considering only ligands validated by MotiveValidator
- Atom count of ligands in structure, considering only ligands validated by MotiveValidator that contain metal atoms
- Atom count of ligands in structure, considering only ligands validated by MotiveValidator, without ligands containing metal atoms
- Atom count of ligands in structure, disregarding water ligands
- Atom count of ligands in structure, disregarding water ligands and ligands containing metal atoms
- Atom count of ligands in structure, without ligands containing metal atoms
- Atom count (structure and ligand atoms)
- Atom count (structure and ligand atoms) on logarithmic scale
- Structure atom count (without ligand atoms)
Average ligand size factor group contains factors which values have been enumerated by a ratio of total number of ligand atoms in a PDB structure to the total number of ligands in a PDB structure. Set of considered ligands is different for each factor (see its name), but both parts of the fraction draw from the same set of ligands. Available in versions: current, yearly 2018, yearly 2017, yearly 2016, yearly 2015.
- Average ligand size in structure
- Average ligand size in structure without ligands containing metal atoms
- Average ligand size in structure without ligands containing metal atoms, considering only ligands validated by MotiveValidator
- Average ligand size in structure without ligands containing metal atoms, disregarding water ligands
- Average ligand size in structure, considering only ligands validated by MotiveValidator
- Average ligand size in structure, considering only ligands validated by MotiveValidator and ligands containing metal atoms
- Average ligand size in structure, considering only ligands with metal atoms
- Average ligand size in structure, disregarding water ligands
Chiral carbon count in ligands factor represents sum of chiral carbon atoms across all ligands in a PDB structure. Available in versions: current, yearly 2018, yearly 2017, yearly 2016, yearly 2015.
Ligand count factor group contains factors which values are sums of ligands in a PDB structure. Set of considered ligands is different for each factor (see its name). Available in versions: current, yearly 2018, yearly 2017, yearly 2016, yearly 2015.
- Ligand count in structure
- Ligand count in structure without ligands containing metal atoms
- Ligand count in structure without ligands containing metal atoms, considering only ligands validated by MotiveValidator
- Ligand count in structure without ligands containing metal atoms, disregarding water ligands
- Ligand count in structure, considering only ligands validated by MotiveValidator and ligands containing metal atoms
- Ligand count in structure, disregarding water ligands
- Ligand count, considering only ligands validated by MotiveValidator
- Ligand count, considering only ligands with metal atoms, in structure
Molecular weight factor group contains factors which values are sums of weight of particular parts of a PDB structure. The unit used here is one kilodalton.
- Biopolymer weight in structure [kDa] Available in versions: current, yearly 2018, yearly 2017, yearly 2016, yearly 2015.
- Ligand and water weight in structure [Da] Available in versions: current, yearly 2018.
- Ligand and water weight in structure [kDa] Available in versions: yearly 2017, yearly 2016, yearly 2015.
- Ligand weight in structure [Da] Available in versions: current, yearly 2018.
- Ligand weight in structure [kDa] Available in versions: yearly 2017, yearly 2016, yearly 2015.
- Total structure weight [kDa] Available in versions: current, yearly 2018, yearly 2017, yearly 2016, yearly 2015.
- Water weight in structure [Da] Available in versions: current, yearly 2018.
- Water weight in structure [kDa] Available in versions: yearly 2017, yearly 2016, yearly 2015.
Preferred structure assembly factor group contain factors that deal with metadata of preferred structure assembly of each PDB structure. Explanation of structure assembly can be found here. Three types of factors can be found in this group. Weight factors enumerate total molecular weight of selected parts of the preferred structure assemblies. Weight unit used here is kilodalton [kDa]. Molecule count factors enumerate total number of molecules of selected types that comprise the preferred structure assembly. Flexibility ratio factor shows how flexible are ligands that comprise the preferred structure assembly. It is enumerated as a ratio of rotatable bonds to all bonds of all ligands in the preferred structure assembly. The higher it is, the more flexible are the ligands.
- Total weight of preferred structure assembly [Da] Available in versions: yearly 2017, yearly 2016.
- Total weight of preferred structure assembly [kDa] Available in versions: current, yearly 2018.
- Total biopolymer weight of preferred structure assembly [Da] Available in versions: yearly 2017, yearly 2016.
- Total biopolymer weight of preferred structure assembly [kDa] Available in versions: current, yearly 2018.
- Total ligand weight of preferred structure assembly [Da] Available in versions: current, yearly 2018, yearly 2017, yearly 2016.
- Total water weight of preferred structure assembly [Da] Available in versions: current, yearly 2018, yearly 2017, yearly 2016.
- Total biopolymer unit count of preferred structure assembly Available in versions: current, yearly 2018, yearly 2017, yearly 2016.
- Total ligand molecule count in preferred structure assembly Available in versions: current, yearly 2018, yearly 2017, yearly 2016.
- Total water molecule count of preferred structure assembly Available in versions: current, yearly 2018, yearly 2017, yearly 2016.
- Number of unique biopolymer units in preferred structure assembly Available in versions: current, yearly 2018, yearly 2017, yearly 2016.
- Number of unique ligand molecules in preferred structure assembly Available in versions: current, yearly 2018, yearly 2017, yearly 2016.
- Flexibility ratio of ligands in preferred structure assembly Available in versions: current, yearly 2018, yearly 2017, yearly 2016.
Ratio of single bonds in ligands factor value is a fraction of sum of all sigma bonds of all ligands in a PDB structure to the sum of all bonds in all ligands in said PDB structure. Available in versions: current, yearly 2018, yearly 2017, yearly 2016, yearly 2015.
Residue count factor group contains factors which values represent the total number of standard residues in a PDB structure. Some factors in this group add number of relevant ligands in a PDB structure to its value (what ligands are relevant for each factor is clear from its name). Available in versions: current, yearly 2018, yearly 2017, yearly 2016, yearly 2015.
- Residue and ligand count in structure
- Residue and ligand count in structure, considering only ligands validated by MotiveValidator
- Residue and ligand count in structure, disregarding water ligands
- Residue count in structure
Structure resolution factor represents highest resolution of a PDB structure in Ångströms. Formally, it is the smallest value of the interplanar spacings for the reflection data to be used in the refinements[link]. Available in versions: current, yearly 2018, yearly 2017, yearly 2016, yearly 2015.
Year of release factor represents the year when a PDB structure was published in the PDB database. Available in versions: current, yearly 2018, yearly 2017, yearly 2016, yearly 2015.
Structure quality factors
Average RSR of residues in structure factor represents the average deviation size of standard residue structure in real space from its atomic model[link]. Available in versions: current, yearly 2018, yearly 2017, yearly 2016, yearly 2015.
Clashscore factor represents the amount of atom clashes (i.e. pairs of atoms that are unusually close to each other) in structure. Formally, it is expressed as number of clashes per thousand atoms of a PDB structure[link]. Ligand atoms are considered as well as atoms of standard residues. Two variants of the clashscore factor have been considered. Available in versions: current, yearly 2018, yearly 2017, yearly 2016, yearly 2015.
- Clashscore structure quality factor: Each PDB structure is represented in this factor by its clashscore structure quality metric.
- Clashscore structure quality factor - percentile version: This factor shows quality of a PDB structure in relation to the rest of structures in the PDB database. Its value ranges from 0 to 100. The higher is its value, the larger portion of structures in the PDB database has lower quality than this structure.
PDBe quality metrics factor group contains factors that represent values of combined quality metrics. These metrics have been developed by the Protein Data Bank in Europe (PDBe) to represent the quality of structure geometry, the quality of X-ray structure fidelity, or the overall quality of a PDB structure. User of the search functionality of the PDBe website can use the combined overall quality metric to sort query results on the basis of their structure quality. Available in versions: current, yearly 2018.
- Combined geometry quality: This is a combination factor that represents quality of geometry of a structure via single numerical value. Percentile value of this factor is the harmonic mean of percentile values of four factors: clashscore, Ramachandran outlier percentage, sidechain outlier percentage, and RNA suiteness. Values of this factor are expected to range from 0 to 100. Higher value signifies higher quality of a structure..
- Combined X-ray model quality: This is a combination factor that represents how well does a structure represent its underlying measured experimental data. Percentile value of this factor is the harmonic mean of percentile values of two factors, Rfree and RSRZ. Values of this factor are expected to range from 0 to 100. Higher value signifies higher quality of a structure.
- Combined overall quality: This is a combination factor that represents overall quality of a structure. Value of this factor is a combination of values of factors combined geometry quality and combined X-ray model quality, along with a correction that consideres resolution of the structure. Higher value of this factor signifies higher quality of a structure.
Ramachandran outliers factor represents percentage of standard residues in a PDB structure that are identified as Ramachandran outliers. A standard residue is identified as a Ramachandran outlier if the combination of backbone φ-ψ torsion angle values is unusual[link]. Two variants of the Ramachandran outliers factor have been considered. Available in versions: current, yearly 2018, yearly 2017, yearly 2016, yearly 2015.
- Ramachandran outliers structure quality factor: Each PDB structure is represented in this factor by its Ramachandran outliers structure quality metric.
- Ramachandran outliers structure quality factor - percentile version: This factor shows quality of a PDB structure in relation to the rest of structures in the PDB database. Its value ranges from 0 to 100. The higher is its value, the larger portion of structures in the PDB database has lower quality than this structure.
R-factor factor group contains factors, which values represent refinement statistics of a PDB structure model. Their values are only applicable to structures that have been obtained using X-ray crystallography.
- Rfree: This factor measures similarity between observed structure factor amplitudes and those calculated from the model while using reflections that were not used during model refinement. Lower value is usually better[link]. Too low value may point to overfitting of the model though. Available in versions: current, yearly 2018, yearly 2017, yearly 2016, yearly 2015.
- Rfree - percentile version: This factor shows quality of a PDB structure in relation to the rest of structures in the PDB database through the Rfree metric. Values fo this factor range from 0 to 100. The higher is its value, the larger portion of structures in the PDB database has lower quality than this structure. Available in versions: current, yearly 2018.
- Rvalue: This factor measures similarity between observed structure factor amplitudes and those calculated from the model. Lower value is usually better[link]. Too low value may point to overfitting of the model though. Available in versions: current, yearly 2018, yearly 2017, yearly 2016, yearly 2015.
RMSZ factor group contains factors that quantify deviation of bond angles and bond lengths in standard residues of a PDB structure. It is calculated for individual standard residues, then averaged for each chain, and then - in the case of two factors from this factor group - averaged over the whole structure. Scores of factors from this factor group are expected to lie between 0 and 1[link]. Available in versions: current, yearly 2018, yearly 2017, yearly 2016, yearly 2015.
- Average RMSZ of bond angles in residues
- Average RMSZ of bond lengths in residues
- Highest RMSZ of bond angles in residues of a chain in structure
- Highest RMSZ of bond lengths in residues of a chain in structure
RSCC factor group contains factors that determine how well the calculated electron density map matches the electron density map that has been computed from experimental data. They are alternatives to the RSR factor family. Standard residue qualifies as an outlier if its RSCC value is below 0.8[link]. Two variants of RSCC factors have been considered. Available in versions: current, yearly 2018, yearly 2017, yearly 2016.
- Average residue RSCC: This factor represents each PDB structure by a RSCC value that has been averaged through all of its standard residues.
- Ratio of RSCC outliers among residues: This factor is valued for each PDB structure as a ratio of the number of standard residues, classified as outliers, to the total number of standard residues that comprise the structure.
RSRZ factor group contains factors that quantify percentage of standard residues in a PDB structure that qualify as real-space R-value outliers (RSRZ). RSRZ is a measure of how much does the fit quality between the atomic model of a standard residue and its data in real space deviate from expected value, as assessed by the RSR validation metric. Standard residue qualifies as an outlier if its RSRZ value is above 2[link]. Two variants of the RSRZ outlier percentage factor have been considered. Available in versions: current, yearly 2018, yearly 2017, yearly 2016, yearly 2015.
- RSRZ outlier percentage in residues: Each PDB structure is represented in this factor by its RSRZ outlier percentage structure quality metric.
- RSRZ outlier count in residues - percentile version: This factor shows quality of a PDB structure in relation to the rest of structures in the PDB database. Its value ranges from 0 to 100. The higher is its value, the larger portion of structures in the PDB database has lower quality than this structure.
Sidechain outliers factor represents percentage of standard residues in a PDB structure with sidechains which torsion angle combination is considered to be an outlier, i.e. is not a preferred combination[link]. Two variants of the Sidechain outliers factor have been considered. Available in versions: current, yearly 2018, yearly 2017, yearly 2016, yearly 2015.
- Sidechain outliers structure quality factor: Each PDB structure is represented in this factor by its Sidechain outliers percentage structure quality metric.
- Sidechain outliers structure quality factor - percentile version: This factor shows quality of a PDB structure in relation to the rest of structures in the PDB database. Its value ranges from 0 to 100. The higher is its value, the larger portion of structures in the PDB database has lower quality than this structure.
Ligand quality factors
Average RSR of ligands in structure factor represents the average deviation size of ligand molecule structure in real space from its atomic model[link]. Available in versions: current, yearly 2018, yearly 2017, yearly 2016, yearly 2015.
Chiral quality of ligands in structure factor group contains factors that quantify the relative amount of chiral carbon atoms with incorrect configuration. Available in versions: current, yearly 2018, yearly 2017, yearly 2016, yearly 2015.
- Ratio of ligands with problems in carbon chirality: Value of this factor is a ratio of ligands that contain at least one chiral carbon atom with incorrect configuration to the total number of ligands in a PDB structure.
- Relative ratio of atoms involved in carbon chirality problems: Value of this factor is a ratio of sum of chiral carbon atoms with incorrect configuration across all ligands of a PDB structure to the total number of chiral carbon atoms across all ligands in the same PDB structure.
- Relative ratio of atoms involved in carbon chirality problems - binary version: Value of this factor is 1 if a ligand in a PDB structure contains at least one chiral carbon atom with incorrect configuration. Otherwise, it is 0.
Combined quality of ligands in structure factor group contains factors that quantify both topological and chiral problems of ligands in a PDB structure (see links for details). Available in versions: current, yearly 2018, yearly 2017, yearly 2016, yearly 2015.
- Ratio of ligands without problems in topology and carbon chirality: Value of this factor is a ratio of ligands that have neither topological problems, nor chiral problems to the total number of ligands in a PDB structure.
- Ratio of ligands without problems in topology and carbon chirality - binary version: Value of this factor is 1 if all ligands of a PDB structure are free from topological and chiral problems. Otherwise, it is 0.
- Relative ratio of atoms involved in topological problems and carbon atoms in carbon chirality problems: Value of this factor is a sum of values of factors Relative ratio of atoms involved in topological problems and Relative ratio of atoms involved in carbon chirality problems.
- Relative ratio of atoms involved in topological problems and carbon atoms in carbon chirality problems - binary version: Value of this factor is 1 if the value of factor Relative ratio of atoms involved in topological problems and carbon atoms in carbon chirality problems is nonzero. Otherwise, it is 0.
LLDF factor group quantifies the Local Ligand Density Values (LLDF) of ligands in a PDB structure. LLDF is a Z-score computed as a statistical comparison of RSR of a ligand to the RSR values of neighboring standard residues that are present within 5 Å of the ligand in question. If there are no standard residues within 5 Å of a ligand, LLDF cannot be computed for such ligand. A ligand is considered to be a negative quality outlier if its LLDF value is greater than 2[link]. Two variants (plus two more) of LLDF factors have been considered.
- Average ligand LLDF: This factor represents each PDB structure by a LLDF value that has been averaged through all of its ligands. Available in versions: yearly 2017, yearly 2016.
- Ratio of LLDF outliers among ligands: This factor is valued for each PDB structure as a ratio of the number of ligands, classified as outliers, to the total number of ligands that comprise the structure. Available in versions: yearly 2017, yearly 2016, yearly 2015.
- Average ligand LLDF of small ligands: This factor represents each PDB structure by a LLDF value that has been averaged through all of its ligands. Only small ligands (with 10 heavy atoms or less) have been considered for this factor. Available in versions: yearly 2017, yearly 2016.
- Average ligand LLDF of big ligands: This factor represents each PDB structure by a LLDF value that has been averaged through all of its ligands. Only big ligands (with 11 heavy atoms or more) have been considered for this factor. Available in versions: yearly 2017, yearly 2016.
RMSZ factor group contains factors that quantify deviation of bond angles and bond lengths in ligands of a PDB structure. It is calculated for individual ligands, then averaged over the whole molecule. Scores of factors from this factor group are expected to lie between 0 and 1[link]. Available in versions: current, yearly 2018, yearly 2017, yearly 2016, yearly 2015.
- Average RMSZ of bond angles in ligands
- Average RMSZ of bond lengths in ligands
RSCC factor group contains factors that determine how well the calculated electron density map matches the electron density map that has been computed from experimental data. They are alternatives to the RSR factor family. Ligand qualifies as an outlier if its RSCC value is below 0.8[link]. Two variants (plus two more) of RSCC factors have been considered. Available in versions: current, yearly 2018, yearly 2017, yearly 2016.
- Average ligand RSCC: This factor represents each PDB structure by a RSCC value that has been averaged through all of its ligands.
- Ratio of RSCC outliers among ligands: This factor is valued for each PDB structure as a ratio of the number of ligands, classified as outliers, to the total number of ligands that comprise the structure.
- Average ligand RSCC of small ligands: This factor represents each PDB structure by a RSCC value that has been averaged through all of its ligands. Only small ligands (with 10 heavy atoms or less) have been considered for this factor.
- Average ligand RSCC of big ligands: This factor represents each PDB structure by a RSCC value that has been averaged through all of its ligands. Only big ligands (with 11 heavy atoms or more) have been considered for this factor.
Topological quality of ligands in structure factor group contains factors that quantify the relative amount of atoms that are either missing or redundant in ligands of a PDB structure. Atoms that are not present in a ligand for chemically valid reasons (e.g. atoms that were lost when a covalent bond was formed) are not quantified by factors from this factor group. Available in versions: current, yearly 2018, yearly 2017, yearly 2016, yearly 2015.
- Ratio of ligands with topological problems: Value of this factor is a ratio of ligands that contain, or are missing, at least one topologically problematic atom to the total number of ligands in a PDB structure.
- Relative ratio of atoms involved in topological problems: Value of this factor is a ratio of sum of topologically problematic atoms across all ligands of a PDB structure to the total number of atoms across all ligands in the same PDB structure.
- Relative ratio of atoms involved in topological problems - binary version: Value of this factor is 1 if a ligand in a PDB structure contains, or is missing, at least one topologically problematic atom. Otherwise, it is 0.
Data acquisition, processing and analysis
Data acquisition and processing
Data for the analysis have been obtained from four sources:
- PDB structure metadata factors (mainly size factors) have been parsed from updated mmCIF structure files from the Protein Data Bank in Europe (PDBe). These files have been obtained from the public FTP server of the PDBe (link here). It is also possible to download updated mmCIF structure files individually from the PDBe website. Updated mmCIF files have been chosen as one of the sources since the old PDB file format is deprecated, and, unlike archive mmCIF structure files, they are free of syntactic errors, and are therefore much more convenient to parse. The macromolecular crystallographic information file (mmCIF) file format is an established textual file format, which contents are given by the PDB Exchange dictionary.
- Additional structure metadata, namely release date, have been obtained using the PDBe REST API. It is a programmatic way to obtain information from the PDB[link]. REST API stands for REpresentational State Transfer Application Programming Interface. Data retrieval from this source has been handled by our custom tool, written in C++ using the Qt SDK.
- Structure quality factors and several additional ligand quality factors have been parsed from the wwPDB X-ray validation reports. These reports have been downloaded from the public FTP server of the PDBe (link here). Alternatively, they can also be downloaded individually for each PDB structure from the PDBe website. The validation reports come in two main forms: Human-readable graphic PDF version, and machine-readable XML version. The XML version has then been parsed by our above mentioned custom tool. The official schema file for the validation reports in XML can be downloaded from the official wwPDB Validation Reports website.
- The core ligand quality factors have been computed on the basis of validation data of ligands in all structures in the PDB that are available in the ValidatorDB database. Only a relevant subset of ligands in structures is validated though (see terminology entry). Validation data in this database are computed every week by the MotiveValidator software. ValidatorDB enables users to download validation data for each PDB structure, or for each ligand type across all PDB structures, through its user interface. However, it is also possible to download the Windows binary of MotiveValidator and run validation task on local PDB database mirror with the same settings that were used to generate the contents of ValidatorDB database. Validation results are available in machine-readable JSON format, and have been parsed using our above mentioned custom tool.
The data from all four sources have then been parsed and merged together using the 4-character PDB ID as the primary key. The parsing task has been handled by our above mentioned custom tool. After parsing, several clean-up steps have been executed so that the data were relevant and useful for the purposes of this analysis. If there were multiple occurrences of the same input value type in an input file, only the first occurrence has been parsed.
Complete raw data, as well as the parsed data, are available for download on the Download page.
Data analysis
The first step in analysing the data at hand was to estimate the existence, type and strength of relationships between pairs of various factors. Such pairs were chosen based on their scientific significance and interest of this group of authors. During the estimation process, the set of prospective factors has expanded several times after successful estimation of several interesting strong relationship between pairs of factors.
The next step was to validate the existence of estimated relationships using methods of statistical analysis, namely using correlation analysis. It has been carried out in four consecutive steps:
Version overview
Below is the outline of versions that are available in ValTrendsDB. Please note that yearly versions are named by the last year from which all PDB entries are included in the analysis. They are not named by the year when the complete dataset for a version was obtained. The reason for the discrepancy between the name of version and the year when it was obtained is that the first update of the PDB database in a year contains the rest of PDB entries from the previous year.
current yyyy-mm-dd
The current version is based on the latest version of source data available, and is updated weekly. The date of origin of this version is included in its name. Unlike yearly versions, the current version was not processed by a statistician. Therefore, the Spearman coefficients are not available for this version. All other outputs of ValTrendsDB are, however, provided by this version as well.
yearly 2018
The yearly 2018 version is based on source data from the 9th January 2019. It contains 4 new factors, namely combined PDBe quality metrics and percentile version of the Rfree metric. It also contains trends among 257 new factor pairs.
An additional difference from the yearly 2017 version is that all LLDF ligand quality factors were omitted, since PDB Validation Reports no longer offer them.
yearly 2017
The yearly 2017 version is based on source data from the 3rd January 2018. It is the first version to include all PDB entries into the analysis, not just structures acquired using X-ray crystallography.
yearly 2016
The yearly 2016 version is based on source data from the 18th January 2017. It contains 19 new factors (e.g., the assembly factors, the RSCC factors for standard residues and ligands) and trends among 533 new factor pairs.
yearly 2015
The yearly 2015 version is based on source data from the 17th February 2016. It is the first version of dataset presented in ValTrendsDB.
Terms of use and GDPR